| Height: | 6-1 |
| Weight: | 190 |
| Year: | SR |
| Hometown: | San Diego, CA |
| High School: | Cathedral Catholic |
| Position: | G |
| Major: | Business & Communications (Johnston Center) |
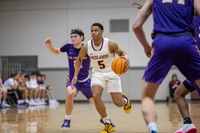
2013-14: Third-year guard for the Bulldogs who saw time in all 25 games… Earned the starting nod on eight occasions… Served as a facilitator for U of R off the bench, distributing 34 assists on the year… Hauled in 50 rebounds, highlighted by 20 on the offensive end… Scored a season-high 13 points against Claremont-Mudd-Scripps Colleges, which came off of a 6-for-7 performance… Named to the NABC Honors Court…
2012-13: Reserve guard for the 2013 SCIAC Champions and SCIAC Postseason Tournament winners… Helped the Bulldogs to record their third 20-plus win season in program history while advancing to the NCAA Tournament… Contributed to the Maroon and Gray’ 11-game win streak late in the season… Competed in 16 games, averaging 5.4 minutes… Scored 22 points on a 54.5 shooting percentage… Pulled in 14 rebounds and dished out 17 assists… Also tallied a pair of steals… Landed on the NABC Honors Court for academic excellence…
2011-12: Gained experience in 12 games as a guard during his rookie season… Averaged 6.4 minutes per game, competing as a guard for the Maroon and Gray… Contributed to the team’s Lee Fulmer Memorial Tournament championship… Came up with 13 defensive boards and distributed six assists… Scored nine points… Traveled to Ireland during the summer and helped the squad to win the Paddy Ryan Memorial Tournament…
| Recent Games | ||
|---|---|---|
| Feb 7 | Cal Lutheran | L, 48-47 |
| Feb 10 | Claremont-M-S | L, 71-56 |
| Feb 14 | at La Verne | L, 59-58 |
| Feb 17 | Chapman | W, 62-59 |
| Feb 21 | Pomona-Pitzer | W, 71-62 |
| Feb 23 | at Whittier | L, 67-57 |
| Statistics category | Overall | Conf | ||
|---|---|---|---|---|
| Games | 24 | 15 | ||
| Games started | 24 | 15 | ||
| Minutes | 622 | 408 | ||
| Minutes per game | 25.9 | 27.2 | ||
| FG | 56-134 | 43-105 | ||
| FG Pct | 41.8 | 41.0 | ||
| 3PT | 2-12 | 2-9 | ||
| 3PT Pct | 16.7 | 22.2 | ||
| FT | 61-83 | 38-51 | ||
| FT Pct | 73.5 | 74.5 | ||
| Off rebounds | 10 | 8 | ||
| Def rebounds | 39 | 23 | ||
| Total rebounds | 49 | 31 | ||
| Rebounds per game | 2.0 | 2.1 | ||
| Personal fouls | 32 | 21 | ||
| Disqualifications | 1 | 1 | ||
| Assists | 47 | 30 | ||
| Turnovers | 38 | 19 | ||
| Assist to turnover ratio | 1.2 | 1.6 | ||
| Steals | 11 | 5 | ||
| Blocks | 1 | 1 | ||
| Points | 175 | 126 | ||
| Points per game | 7.3 | 8.4 | ||
| Points per 40 min | 11.3 | 12.4 | ||
| Date | Opponent | Score | gs | min | fg | pct | 3pt | pct | ft | pct | pts |
|---|---|---|---|---|---|---|---|---|---|---|---|
| Nov 4 | at Concordia (Cal.) | L, 128-85 | - | 15 | 2-3 | 66.7 | 0-1 | 0.0 | 3-4 | 75.0 | 7 |
| Nov 16 | vs. Dallas | L, 75-73 | 1 | 30 | 2-4 | 50.0 | 0-0 | - | 2-3 | 66.7 | 6 |
| Nov 17 | at UC Santa Cruz | L, 57-55 | 1 | 29 | 1-4 | 25.0 | 0-0 | - | 0-0 | - | 2 |
| Nov 21 | Bethesda University | W, 83-68 | 1 | 20 | 2-2 | 100.0 | 0-0 | - | 4-4 | 100.0 | 8 |
| Nov 22 | American Sports Univ | W, 101-68 | 1 | 19 | 3-5 | 60.0 | 0-0 | - | 2-2 | 100.0 | 8 |
| Nov 26 | Whitworth | L, 80-61 | 1 | 22 | 1-2 | 50.0 | 0-0 | - | 3-6 | 50.0 | 5 |
| Dec 6 | North Central (Ill.) | L, 64-47 | 1 | 18 | 0-1 | 0.0 | 0-1 | 0.0 | 3-4 | 75.0 | 3 |
| Dec 16 | Bristol | W, 82-77 | 1 | 26 | 1-2 | 50.0 | 0-0 | - | 3-6 | 50.0 | 5 |
| Dec 29 | vs. Albion | L, 50-47 | 1 | 27 | 2-6 | 33.3 | 0-1 | 0.0 | 6-7 | 85.7 | 10 |
| Dec 30 | vs. UC Santa Cruz | L, 68-57 | 1 | 23 | 1-3 | 33.3 | 0-1 | 0.0 | 0-0 | - | 2 |
| Jan 3 | at Claremont-M-S | L, 68-44 | 1 | 17 | 1-3 | 33.3 | 1-1 | 100.0 | 0-0 | - | 3 |
| Jan 6 | at Cal Lutheran | L, 71-56 | 1 | 28 | 2-5 | 40.0 | 0-0 | - | 3-4 | 75.0 | 7 |
| Jan 10 | Caltech | W, 76-57 | 1 | 25 | 8-12 | 66.7 | 0-0 | - | 7-8 | 87.5 | 23 |
| Jan 13 | Occidental | W, 85-65 | 1 | 27 | 5-8 | 62.5 | 0-0 | - | 4-4 | 100.0 | 14 |
| Jan 20 | at Pomona-Pitzer | L, 54-52 | 1 | 29 | 3-7 | 42.9 | 0-2 | 0.0 | 2-5 | 40.0 | 8 |
| Jan 22 | Whittier | L, 93-90 | 1 | 47 | 8-15 | 53.3 | 0-0 | - | 1-2 | 50.0 | 17 |
| Jan 24 | at Chapman | L, 83-63 | 1 | 19 | 4-7 | 57.1 | 0-0 | - | 0-0 | - | 8 |
| Jan 27 | La Verne | L, 69-50 | 1 | 27 | 1-7 | 14.3 | 1-2 | 50.0 | 2-4 | 50.0 | 5 |
| Jan 31 | at Occidental | L, 76-72 | 1 | 24 | 3-6 | 50.0 | 0-0 | - | 8-8 | 100.0 | 14 |
| Feb 3 | at Caltech | L, 49-47 | 1 | 29 | 2-8 | 25.0 | 0-0 | - | 2-2 | 100.0 | 6 |
| Feb 7 | Cal Lutheran | L, 48-47 | 1 | 32 | 2-8 | 25.0 | 0-0 | - | 3-4 | 75.0 | 7 |
| Feb 10 | Claremont-M-S | L, 71-56 | 1 | 31 | 2-6 | 33.3 | 0-2 | 0.0 | 1-2 | 50.0 | 5 |
| Feb 14 | at La Verne | L, 59-58 | 1 | 26 | 1-5 | 20.0 | 0-1 | 0.0 | 2-2 | 100.0 | 4 |
| Feb 17 | Chapman | W, 62-59 | - | - | - | - | - | - | - | - | - |
| Feb 21 | Pomona-Pitzer | W, 71-62 | 1 | 26 | 0-3 | 0.0 | 0-0 | - | 3-6 | 50.0 | 3 |
| Feb 23 | at Whittier | L, 67-57 | 1 | 21 | 1-5 | 20.0 | 0-1 | 0.0 | 0-0 | - | 2 |
| Date | Opponent | Score | gs | min | off | def | reb | ast | to | a/to | stl | blk | pf | dq |
|---|---|---|---|---|---|---|---|---|---|---|---|---|---|---|
| Nov 4 | at Concordia (Cal.) | L, 128-85 | - | 15 | 0 | 0 | 0 | 0 | 1 | 0.0 | 0 | 0 | 2 | - |
| Nov 16 | vs. Dallas | L, 75-73 | 1 | 30 | 0 | 3 | 3 | 2 | 3 | 0.7 | 0 | 0 | 2 | 0 |
| Nov 17 | at UC Santa Cruz | L, 57-55 | 1 | 29 | 1 | 2 | 3 | 3 | 4 | 0.8 | 2 | 0 | 2 | 0 |
| Nov 21 | Bethesda University | W, 83-68 | 1 | 20 | 0 | 0 | 0 | 2 | 0 | - | 0 | 0 | 1 | - |
| Nov 22 | American Sports Univ | W, 101-68 | 1 | 19 | 0 | 4 | 4 | 6 | 0 | - | 0 | 0 | 0 | - |
| Nov 26 | Whitworth | L, 80-61 | 1 | 22 | 0 | 0 | 0 | 0 | 3 | 0.0 | 0 | 0 | 2 | - |
| Dec 6 | North Central (Ill.) | L, 64-47 | 1 | 18 | 0 | 1 | 1 | 0 | 2 | 0.0 | 1 | 0 | 1 | - |
| Dec 16 | Bristol | W, 82-77 | 1 | 26 | 1 | 2 | 3 | 2 | 3 | 0.7 | 2 | 0 | 0 | 0 |
| Dec 29 | vs. Albion | L, 50-47 | 1 | 27 | 0 | 0 | 0 | 1 | 1 | 1.0 | 1 | 0 | 1 | - |
| Dec 30 | vs. UC Santa Cruz | L, 68-57 | 1 | 23 | 0 | 4 | 4 | 1 | 3 | 0.3 | 0 | 0 | 2 | - |
| Jan 3 | at Claremont-M-S | L, 68-44 | 1 | 17 | 0 | 0 | 0 | 0 | 4 | 0.0 | 1 | 0 | 2 | - |
| Jan 6 | at Cal Lutheran | L, 71-56 | 1 | 28 | 0 | 2 | 2 | 0 | 0 | - | 0 | 0 | 0 | - |
| Jan 10 | Caltech | W, 76-57 | 1 | 25 | 0 | 1 | 1 | 1 | 1 | 1.0 | 1 | 0 | 2 | - |
| Jan 13 | Occidental | W, 85-65 | 1 | 27 | 1 | 1 | 2 | 4 | 2 | 2.0 | 0 | 0 | 3 | - |
| Jan 20 | at Pomona-Pitzer | L, 54-52 | 1 | 29 | 1 | 2 | 3 | 4 | 2 | 2.0 | 0 | 0 | 2 | - |
| Jan 22 | Whittier | L, 93-90 | 1 | 47 | 1 | 4 | 5 | 6 | 2 | 3.0 | 1 | 0 | 1 | - |
| Jan 24 | at Chapman | L, 83-63 | 1 | 19 | 1 | 2 | 3 | 2 | 0 | - | 0 | 1 | 0 | - |
| Jan 27 | La Verne | L, 69-50 | 1 | 27 | 0 | 1 | 1 | 0 | 2 | 0.0 | 1 | 0 | 1 | - |
| Jan 31 | at Occidental | L, 76-72 | 1 | 24 | 0 | 2 | 2 | 0 | 2 | 0.0 | 0 | 0 | 5 | 1 |
| Feb 3 | at Caltech | L, 49-47 | 1 | 29 | 1 | 0 | 1 | 2 | 1 | 2.0 | 1 | 0 | 0 | - |
| Feb 7 | Cal Lutheran | L, 48-47 | 1 | 32 | 1 | 1 | 2 | 0 | 1 | 0.0 | 0 | 0 | 2 | - |
| Feb 10 | Claremont-M-S | L, 71-56 | 1 | 31 | 0 | 1 | 1 | 6 | 0 | - | 0 | 0 | 0 | - |
| Feb 14 | at La Verne | L, 59-58 | 1 | 26 | 0 | 2 | 2 | 1 | 0 | - | 0 | 0 | 1 | - |
| Feb 17 | Chapman | W, 62-59 | - | - | - | - | - | - | - | - | - | - | - | - |
| Feb 21 | Pomona-Pitzer | W, 71-62 | 1 | 26 | 0 | 2 | 2 | 1 | 0 | - | 0 | 0 | 1 | - |
| Feb 23 | at Whittier | L, 67-57 | 1 | 21 | 2 | 2 | 4 | 3 | 2 | 1.5 | 0 | 0 | 1 | - |
| gp | gs | min/g | fg/g | pct | 3pt/g | pct | ft/g | pct | ppg | |
|---|---|---|---|---|---|---|---|---|---|---|
| 2011-12 | 13 | 1 | 7.8 | 0.6-1.6 | 38.1 | 0.0-0.1 | 0.0 | 0.4-1.0 | 38.5 | 1.6 |
| 2012-13 | 16 | - | 5.4 | 0.4-0.7 | 54.5 | 0.0-0.1 | 0.0 | 0.6-1.1 | 58.8 | 1.4 |
| 2013-14 | 25 | 7 | 14.0 | 1.2-2.5 | 46.0 | 0.0-0.1 | 50.0 | 1.6-2.6 | 62.5 | 4.0 |
| 2014-15 | 24 | 24 | 25.9 | 2.3-5.6 | 41.8 | 0.1-0.5 | 16.7 | 2.5-3.5 | 73.5 | 7.3 |
| Total | 78 | 32 | 14.9 | 1.3-2.9 | 43.2 | 0.0-0.2 | 17.6 | 1.5-2.3 | 65.5 | 4.1 |
| gp | gs | min/g | fg/40 | pct | 3pt/40 | pct | ft/40 | pct | pts/40 | |
|---|---|---|---|---|---|---|---|---|---|---|
| 2011-12 | 13 | 1 | 7.8 | 3.1-8.2 | 38.1 | 0.0-0.4 | 0.0 | 2.0-5.1 | 38.5 | 8.2 |
| 2012-13 | 16 | - | 5.4 | 2.8-5.1 | 54.5 | 0.0-0.9 | 0.0 | 4.6-7.8 | 58.8 | 10.1 |
| 2013-14 | 25 | 7 | 14.0 | 3.3-7.2 | 46.0 | 0.1-0.2 | 50.0 | 4.6-7.3 | 62.5 | 11.3 |
| 2014-15 | 24 | 24 | 25.9 | 3.6-8.6 | 41.8 | 0.1-0.8 | 16.7 | 3.9-5.3 | 73.5 | 11.3 |
| Total | 78 | 32 | 14.9 | 3.4-7.9 | 43.2 | 0.1-0.6 | 17.6 | 4.0-6.1 | 65.5 | 10.9 |
| gp | gs | mpg | off/g | def/g | reb/g | pf/g | dq/g | ast/g | to/g | a/to | stl/g | blk/g | |
|---|---|---|---|---|---|---|---|---|---|---|---|---|---|
| 2011-12 | 13 | 1 | 7.8 | 0.1 | 1.1 | 1.2 | 1.0 | 0.0 | 0.5 | 0.8 | 0.6 | 0.2 | 0.0 |
| 2012-13 | 16 | - | 5.4 | 0.1 | 0.8 | 0.9 | 0.4 | 0.0 | 1.1 | 0.8 | 1.3 | 0.1 | 0.0 |
| 2013-14 | 25 | 7 | 14.0 | 0.8 | 1.2 | 2.0 | 1.0 | 0.0 | 1.4 | 0.8 | 1.8 | 0.6 | 0.0 |
| 2014-15 | 24 | 24 | 25.9 | 0.4 | 1.6 | 2.0 | 1.3 | 0.0 | 2.0 | 1.6 | 1.2 | 0.5 | 0.0 |
| Total | 78 | 32 | 14.9 | 0.4 | 1.2 | 1.6 | 1.0 | 0.0 | 1.3 | 1.0 | 1.3 | 0.4 | 0.0 |
| gp | gs | mpg | off/40 | def/40 | reb/40 | pf/40 | dq/40 | ast/40 | to/40 | a/to | stl/40 | blk/40 | |
|---|---|---|---|---|---|---|---|---|---|---|---|---|---|
| 2011-12 | 13 | 1 | 7.8 | 0.4 | 5.5 | 5.9 | 5.1 | 0.0 | 2.4 | 3.9 | 0.6 | 1.2 | 0.0 |
| 2012-13 | 16 | - | 5.4 | 0.9 | 5.5 | 6.4 | 3.2 | 0.0 | 7.8 | 6.0 | 1.3 | 0.9 | 0.0 |
| 2013-14 | 25 | 7 | 14.0 | 2.3 | 3.4 | 5.7 | 3.0 | 0.0 | 3.9 | 2.2 | 1.8 | 1.6 | 0.1 |
| 2014-15 | 24 | 24 | 25.9 | 0.6 | 2.5 | 3.2 | 2.1 | 0.1 | 3.0 | 2.4 | 1.2 | 0.7 | 0.1 |
| Total | 78 | 32 | 14.9 | 1.1 | 3.3 | 4.4 | 2.7 | 0.0 | 3.6 | 2.8 | 1.3 | 1.0 | 0.1 |
| gp | gs | min/g | fg/g | pct | 3pt/g | pct | ft/g | pct | ppg | |
|---|---|---|---|---|---|---|---|---|---|---|
| Total | 24 | 24 | 25.9 | 2.3-5.6 | 41.8 | 0.1-0.5 | 16.7 | 2.5-3.5 | 73.5 | 7.3 |
| Conference | 15 | 15 | 27.2 | 2.9-7.0 | 41.0 | 0.1-0.6 | 22.2 | 2.5-3.4 | 74.5 | 8.4 |
| Exhibition | 1 | - | 15.0 | 2.0-3.0 | 66.7 | 0.0-1.0 | 0.0 | 3.0-4.0 | 75.0 | 7.0 |
- | ||||||||||
| Home | 12 | 12 | 26.7 | 2.8-5.9 | 46.5 | 0.1-0.4 | 20.0 | 3.0-4.3 | 69.2 | 8.6 |
| Away | 9 | 9 | 24.7 | 2.0-5.6 | 36.0 | 0.1-0.6 | 20.0 | 1.9-2.3 | 81.0 | 6.0 |
| Neutral | 3 | 3 | 26.7 | 1.7-4.3 | 38.5 | 0.0-0.7 | 0.0 | 2.7-3.3 | 80.0 | 6.0 |
- | ||||||||||
| Wins | 6 | 6 | 23.8 | 3.2-5.3 | 59.4 | 0.0-0.0 | - | 3.8-5.0 | 76.7 | 10.2 |
| Losses | 18 | 18 | 26.6 | 2.1-5.7 | 36.3 | 0.1-0.7 | 16.7 | 2.1-2.9 | 71.7 | 6.3 |
- | ||||||||||
| November | 5 | 5 | 24.0 | 1.8-3.4 | 52.9 | 0.0-0.0 | - | 2.2-3.0 | 73.3 | 5.8 |
| December | 4 | 4 | 23.5 | 1.0-3.0 | 33.3 | 0.0-0.8 | 0.0 | 3.0-4.2 | 70.6 | 5.0 |
| January | 9 | 9 | 27.0 | 3.9-7.8 | 50.0 | 0.2-0.6 | 40.0 | 3.0-3.9 | 77.1 | 11.0 |
| February | 6 | 6 | 27.5 | 1.3-5.8 | 22.9 | 0.0-0.7 | 0.0 | 1.8-2.7 | 68.8 | 4.5 |
| gp | gs | min | fg | pct | 3pt | pct | ft | pct | pts | |
|---|---|---|---|---|---|---|---|---|---|---|
| Total | 24 | 24 | 622 | 56-134 | 41.8 | 2-12 | 16.7 | 61-83 | 73.5 | 175 |
| Conference | 15 | 15 | 408 | 43-105 | 41.0 | 2-9 | 22.2 | 38-51 | 74.5 | 126 |
| Exhibition | 1 | - | 15 | 2-3 | 66.7 | 0-1 | 0.0 | 3-4 | 75.0 | 7 |
- | ||||||||||
| Home | 12 | 12 | 320 | 33-71 | 46.5 | 1-5 | 20.0 | 36-52 | 69.2 | 103 |
| Away | 9 | 9 | 222 | 18-50 | 36.0 | 1-5 | 20.0 | 17-21 | 81.0 | 54 |
| Neutral | 3 | 3 | 80 | 5-13 | 38.5 | 0-2 | 0.0 | 8-10 | 80.0 | 18 |
- | ||||||||||
| Wins | 6 | 6 | 143 | 19-32 | 59.4 | 0-0 | - | 23-30 | 76.7 | 61 |
| Losses | 18 | 18 | 479 | 37-102 | 36.3 | 2-12 | 16.7 | 38-53 | 71.7 | 114 |
- | ||||||||||
| November | 5 | 5 | 120 | 9-17 | 52.9 | 0-0 | - | 11-15 | 73.3 | 29 |
| December | 4 | 4 | 94 | 4-12 | 33.3 | 0-3 | 0.0 | 12-17 | 70.6 | 20 |
| January | 9 | 9 | 243 | 35-70 | 50.0 | 2-5 | 40.0 | 27-35 | 77.1 | 99 |
| February | 6 | 6 | 165 | 8-35 | 22.9 | 0-4 | 0.0 | 11-16 | 68.8 | 27 |
| gp | gs | min/g | fg/40 | pct | 3pt/40 | pct | ft/40 | pct | pts/40 | |
|---|---|---|---|---|---|---|---|---|---|---|
| Total | 24 | 24 | 25.9 | 3.6-8.6 | 41.8 | 0.1-0.8 | 16.7 | 3.9-5.3 | 73.5 | 11.3 |
| Conference | 15 | 15 | 27.2 | 4.2-10.3 | 41.0 | 0.2-0.9 | 22.2 | 3.7-5.0 | 74.5 | 12.4 |
| Exhibition | 1 | - | 15.0 | 5.3-8.0 | 66.7 | 0.0-2.7 | 0.0 | 8.0-10.7 | 75.0 | 18.7 |
- | ||||||||||
| Home | 12 | 12 | 26.7 | 4.1-8.9 | 46.5 | 0.1-0.6 | 20.0 | 4.5-6.5 | 69.2 | 12.9 |
| Away | 9 | 9 | 24.7 | 3.2-9.0 | 36.0 | 0.2-0.9 | 20.0 | 3.1-3.8 | 81.0 | 9.7 |
| Neutral | 3 | 3 | 26.7 | 2.5-6.5 | 38.5 | 0.0-1.0 | 0.0 | 4.0-5.0 | 80.0 | 9.0 |
- | ||||||||||
| Wins | 6 | 6 | 23.8 | 5.3-9.0 | 59.4 | 0.0-0.0 | - | 6.4-8.4 | 76.7 | 17.1 |
| Losses | 18 | 18 | 26.6 | 3.1-8.5 | 36.3 | 0.2-1.0 | 16.7 | 3.2-4.4 | 71.7 | 9.5 |
- | ||||||||||
| November | 5 | 5 | 24.0 | 3.0-5.7 | 52.9 | 0.0-0.0 | - | 3.7-5.0 | 73.3 | 9.7 |
| December | 4 | 4 | 23.5 | 1.7-5.1 | 33.3 | 0.0-1.3 | 0.0 | 5.1-7.2 | 70.6 | 8.5 |
| January | 9 | 9 | 27.0 | 5.8-11.5 | 50.0 | 0.3-0.8 | 40.0 | 4.4-5.8 | 77.1 | 16.3 |
| February | 6 | 6 | 27.5 | 1.9-8.5 | 22.9 | 0.0-1.0 | 0.0 | 2.7-3.9 | 68.8 | 6.5 |
| gp | gs | mpg | off/g | def/g | reb/g | pf/g | dq/g | ast/g | to/g | a/to | stl/g | blk/g | |
|---|---|---|---|---|---|---|---|---|---|---|---|---|---|
| Total | 24 | 24 | 25.9 | 0.4 | 1.6 | 2.0 | 1.3 | 0.0 | 2.0 | 1.6 | 1.2 | 0.5 | 0.0 |
| Conference | 15 | 15 | 27.2 | 0.5 | 1.5 | 2.1 | 1.4 | 0.1 | 2.0 | 1.3 | 1.6 | 0.3 | 0.1 |
| Exhibition | 1 | - | 15.0 | 0.0 | 0.0 | 0.0 | 2.0 | - | 0.0 | 1.0 | 0.0 | 0.0 | 0.0 |
- | |||||||||||||
| Home | 12 | 12 | 26.7 | 0.3 | 1.5 | 1.8 | 1.2 | 0.0 | 2.3 | 1.3 | 1.8 | 0.5 | 0.0 |
| Away | 9 | 9 | 24.7 | 0.7 | 1.6 | 2.2 | 1.4 | 0.1 | 1.7 | 1.7 | 1.0 | 0.4 | 0.1 |
| Neutral | 3 | 3 | 26.7 | 0.0 | 2.3 | 2.3 | 1.7 | 0.0 | 1.3 | 2.3 | 0.6 | 0.3 | 0.0 |
- | |||||||||||||
| Wins | 6 | 6 | 23.8 | 0.3 | 1.7 | 2.0 | 1.2 | 0.0 | 2.7 | 1.0 | 2.7 | 0.5 | 0.0 |
| Losses | 18 | 18 | 26.6 | 0.4 | 1.6 | 2.1 | 1.4 | 0.1 | 1.7 | 1.8 | 1.0 | 0.4 | 0.1 |
- | |||||||||||||
| November | 5 | 5 | 24.0 | 0.2 | 1.8 | 2.0 | 1.4 | 0.0 | 2.6 | 2.0 | 1.3 | 0.4 | 0.0 |
| December | 4 | 4 | 23.5 | 0.3 | 1.8 | 2.0 | 1.0 | 0.0 | 1.0 | 2.3 | 0.4 | 1.0 | 0.0 |
| January | 9 | 9 | 27.0 | 0.4 | 1.7 | 2.1 | 1.8 | 0.1 | 1.9 | 1.7 | 1.1 | 0.4 | 0.1 |
| February | 6 | 6 | 27.5 | 0.7 | 1.3 | 2.0 | 0.8 | - | 2.2 | 0.7 | 3.3 | 0.2 | 0.0 |
| gp | gs | min | off | def | reb | pf | dq | ast | to | a/to | stl | blk | |
|---|---|---|---|---|---|---|---|---|---|---|---|---|---|
| Total | 24 | 24 | 622 | 10 | 39 | 49 | 32 | 1 | 47 | 38 | 1.2 | 11 | 1 |
| Conference | 15 | 15 | 408 | 8 | 23 | 31 | 21 | 1 | 30 | 19 | 1.6 | 5 | 1 |
| Exhibition | 1 | - | 15 | 0 | 0 | 0 | 2 | - | 0 | 1 | 0.0 | 0 | 0 |
- | |||||||||||||
| Home | 12 | 12 | 320 | 4 | 18 | 22 | 14 | 0 | 28 | 16 | 1.8 | 6 | 0 |
| Away | 9 | 9 | 222 | 6 | 14 | 20 | 13 | 1 | 15 | 15 | 1.0 | 4 | 1 |
| Neutral | 3 | 3 | 80 | 0 | 7 | 7 | 5 | 0 | 4 | 7 | 0.6 | 1 | 0 |
- | |||||||||||||
| Wins | 6 | 6 | 143 | 2 | 10 | 12 | 7 | 0 | 16 | 6 | 2.7 | 3 | 0 |
| Losses | 18 | 18 | 479 | 8 | 29 | 37 | 25 | 1 | 31 | 32 | 1.0 | 8 | 1 |
- | |||||||||||||
| November | 5 | 5 | 120 | 1 | 9 | 10 | 7 | 0 | 13 | 10 | 1.3 | 2 | 0 |
| December | 4 | 4 | 94 | 1 | 7 | 8 | 4 | 0 | 4 | 9 | 0.4 | 4 | 0 |
| January | 9 | 9 | 243 | 4 | 15 | 19 | 16 | 1 | 17 | 15 | 1.1 | 4 | 1 |
| February | 6 | 6 | 165 | 4 | 8 | 12 | 5 | - | 13 | 4 | 3.3 | 1 | 0 |
| gp | gs | mpg | off/40 | def/40 | reb/40 | pf/40 | dq/40 | ast/40 | to/40 | a/to | stl/40 | blk/40 | |
|---|---|---|---|---|---|---|---|---|---|---|---|---|---|
| Total | 24 | 24 | 25.9 | 0.6 | 2.5 | 3.2 | 2.1 | 0.1 | 3.0 | 2.4 | 1.2 | 0.7 | 0.1 |
| Conference | 15 | 15 | 27.2 | 0.8 | 2.3 | 3.0 | 2.1 | 0.1 | 2.9 | 1.9 | 1.6 | 0.5 | 0.1 |
| Exhibition | 1 | - | 15.0 | 0.0 | 0.0 | 0.0 | 5.3 | 0.0 | 0.0 | 2.7 | 0.0 | 0.0 | 0.0 |
- | |||||||||||||
| Home | 12 | 12 | 26.7 | 0.5 | 2.3 | 2.8 | 1.8 | 0.0 | 3.5 | 2.0 | 1.8 | 0.8 | 0.0 |
| Away | 9 | 9 | 24.7 | 1.1 | 2.5 | 3.6 | 2.3 | 0.2 | 2.7 | 2.7 | 1.0 | 0.7 | 0.2 |
| Neutral | 3 | 3 | 26.7 | 0.0 | 3.5 | 3.5 | 2.5 | 0.0 | 2.0 | 3.5 | 0.6 | 0.5 | 0.0 |
- | |||||||||||||
| Wins | 6 | 6 | 23.8 | 0.6 | 2.8 | 3.4 | 2.0 | 0.0 | 4.5 | 1.7 | 2.7 | 0.8 | 0.0 |
| Losses | 18 | 18 | 26.6 | 0.7 | 2.4 | 3.1 | 2.1 | 0.1 | 2.6 | 2.7 | 1.0 | 0.7 | 0.1 |
- | |||||||||||||
| November | 5 | 5 | 24.0 | 0.3 | 3.0 | 3.3 | 2.3 | 0.0 | 4.3 | 3.3 | 1.3 | 0.7 | 0.0 |
| December | 4 | 4 | 23.5 | 0.4 | 3.0 | 3.4 | 1.7 | 0.0 | 1.7 | 3.8 | 0.4 | 1.7 | 0.0 |
| January | 9 | 9 | 27.0 | 0.7 | 2.5 | 3.1 | 2.6 | 0.2 | 2.8 | 2.5 | 1.1 | 0.7 | 0.2 |
| February | 6 | 6 | 27.5 | 1.0 | 1.9 | 2.9 | 1.2 | 0.0 | 3.2 | 1.0 | 3.3 | 0.2 | 0.0 |

