3


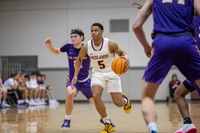
3 - Brittian Foster
| Height: | 6-3 |
| Weight: | 185 |
| Year: | SR |
| Hometown: | Long Beach, CA |
| High School: | Lakewood |
| Position: | W |
| Major: | Physics |
gp
27
pts/g
5.6
fg %
45.0
3pt %
23.5
ft %
65.3
reb/g
2.4
a/g
1.1
2018-19
- Helped the team to a SCIAC semifinal appearance for the first time since the 2015-16 season
- Competed in 22 games, while starting in 10
- Averaged 5.0 points per game
- Shot 48.2% from the field
2017-18
- Sophomore forward for the Maroon and Gray
- Battled through injury but competed in 17 games while making two starts
- Shot 43.8% from the field for 81 points on the season
- Hauled in 47 rebounds, including 18 on the offensive end
- Added seven assists, four steals, and four blocks
- Started the season off with a 16-point showing against Westmont College on Nov. 11
- Scored in double figures on four more occasions
2016-17
- First-year guard for the Bulldogs
- Competed in 21 games for 136 minutes
- Scored 34 points and pulled in 32 rebounds
- Also nabbed eight steals and dished out four assists
Fun Facts
- Career ambition: Environmental Engineer
- Favorite professional athlete: Kobe Bryant
- Favorite music artist/band: ‘Til Tuesday
- Favorite food: Mac & Cheese
- Favorite inspirational quote: “Every man is defined by his reaction to any given situation. Who would you want to define you? Someone else or yourself?”
- Why did you choose to become a Bulldogs student-athlete: To continue my passion for the game of basketball
| Recent Games | ||
|---|---|---|
| Feb 15 | at Caltech | W, 92-75 |
| Feb 19 | at Claremont-M-S | W, 82-80 |
| Feb 22 | at Whittier | W, 105-90 |
| Feb 25 | La Verne | W, 103-73 |
| Feb 28 | Claremont-M-S | W, 68-66 |
| Feb 29 | at Pomona-Pitzer | L, 87-66 |
| Statistics category | Overall | Conf | ||
|---|---|---|---|---|
| Games | 27 | 16 | ||
| Games started | 3 | 3 | ||
| Minutes | 358 | 219 | ||
| Minutes per game | 13.3 | 13.7 | ||
| FG | 58-129 | 33-73 | ||
| FG Pct | 45.0 | 45.2 | ||
| 3PT | 4-17 | 1-9 | ||
| 3PT Pct | 23.5 | 11.1 | ||
| FT | 32-49 | 16-27 | ||
| FT Pct | 65.3 | 59.3 | ||
| Off rebounds | 22 | 14 | ||
| Def rebounds | 43 | 21 | ||
| Total rebounds | 65 | 35 | ||
| Rebounds per game | 2.4 | 2.2 | ||
| Personal fouls | 48 | 27 | ||
| Disqualifications | 0 | 0 | ||
| Assists | 29 | 19 | ||
| Turnovers | 42 | 25 | ||
| Assist to turnover ratio | 0.7 | 0.8 | ||
| Steals | 21 | 12 | ||
| Blocks | 4 | 2 | ||
| Points | 152 | 83 | ||
| Points per game | 5.6 | 5.2 | ||
| Points per 40 min | 17.0 | 15.2 | ||
| Date | Opponent | Score | gs | min | fg | pct | 3pt | pct | ft | pct | pts |
|---|---|---|---|---|---|---|---|---|---|---|---|
| Oct 26 | Alumni | - | - | - | - | - | - | - | - | - | |
| Nov 2 | California Miramar | W, 101-70 | - | - | - | - | - | - | - | - | - |
| Nov 8 | Texas-Dallas | L, 74-71 | - | 15 | 0-5 | 0.0 | 0-1 | 0.0 | 2-2 | 100.0 | 2 |
| Nov 9 | Linfield | W, 94-69 | - | 15 | 2-6 | 33.3 | 1-2 | 50.0 | 2-2 | 100.0 | 7 |
| Nov 15 | Luther | W, 87-62 | - | 18 | 5-7 | 71.4 | 0-1 | 0.0 | 0-0 | - | 10 |
| Nov 16 | Southwestern (Tex.) | W, 87-70 | - | 8 | 1-5 | 20.0 | 0-2 | 0.0 | 0-0 | - | 2 |
| Nov 21 | at UC Riverside | L, 76-44 | - | 13 | 1-3 | 33.3 | 0-1 | 0.0 | 0-0 | - | 2 |
| Nov 27 | at UC Santa Cruz | W, 72-50 | - | 18 | 4-8 | 50.0 | 0-0 | - | 1-3 | 33.3 | 9 |
| Dec 4 | at Occidental | W, 83-73 | - | 10 | 2-4 | 50.0 | 0-0 | - | 0-0 | - | 4 |
| Dec 7 | Puget Sound | L, 74-72 | - | 7 | 1-2 | 50.0 | 0-0 | - | 0-0 | - | 2 |
| Dec 16 | UC Santa Cruz | W, 61-49 | - | 8 | 0-1 | 0.0 | 0-0 | - | 0-1 | 0.0 | 0 |
| Dec 18 | vs. Simpson | W, 87-75 | - | 15 | 4-7 | 57.1 | 1-1 | 100.0 | 3-4 | 75.0 | 12 |
| Dec 31 | Bethesda University | W, 97-86 | - | 15 | 4-7 | 57.1 | 0-0 | - | 5-6 | 83.3 | 13 |
| Jan 4 | Cal Lutheran | L, 68-65 | - | 17 | 2-3 | 66.7 | 0-0 | - | 0-0 | - | 4 |
| Jan 6 | at La Verne | W, 80-58 | - | 16 | 6-9 | 66.7 | 0-0 | - | 1-2 | 50.0 | 13 |
| Jan 11 | at Pomona-Pitzer | L, 86-74 | - | 12 | 1-4 | 25.0 | 0-0 | - | 0-0 | - | 2 |
| Jan 15 | Claremont-M-S | L, 77-60 | - | 22 | 2-6 | 33.3 | 0-1 | 0.0 | 0-0 | - | 4 |
| Jan 18 | Caltech | W, 67-62 | 1 | 16 | 2-7 | 28.6 | 0-1 | 0.0 | 1-3 | 33.3 | 5 |
| Jan 22 | at Chapman | L, 82-78 | 1 | 12 | 2-4 | 50.0 | 0-1 | 0.0 | 0-0 | - | 4 |
| Jan 25 | Whittier | W, 105-86 | - | 14 | 0-2 | 0.0 | 0-0 | - | 2-2 | 100.0 | 2 |
| Feb 1 | at Cal Lutheran | W, 100-61 | - | 12 | 4-4 | 100.0 | 1-1 | 100.0 | 0-1 | 0.0 | 9 |
| Feb 5 | Occidental | W, 85-60 | - | 10 | 2-5 | 40.0 | 0-0 | - | 0-0 | - | 4 |
| Feb 8 | Pomona-Pitzer | W, 94-77 | - | 15 | 1-3 | 33.3 | 0-1 | 0.0 | 3-3 | 100.0 | 5 |
| Feb 12 | Chapman | W, 87-81 | - | 9 | 2-6 | 33.3 | 0-1 | 0.0 | 1-2 | 50.0 | 5 |
| Feb 15 | at Caltech | W, 92-75 | - | 15 | 0-3 | 0.0 | 0-1 | 0.0 | 1-2 | 50.0 | 1 |
| Feb 19 | at Claremont-M-S | W, 82-80 | - | 11 | 2-4 | 50.0 | 0-2 | 0.0 | 4-6 | 66.7 | 8 |
| Feb 22 | at Whittier | W, 105-90 | - | 15 | 2-5 | 40.0 | 0-0 | - | 2-4 | 50.0 | 6 |
| Feb 25 | La Verne | W, 103-73 | 1 | 13 | 3-4 | 75.0 | 0-0 | - | 1-2 | 50.0 | 7 |
| Feb 28 | Claremont-M-S | W, 68-66 | - | 12 | 2-4 | 50.0 | 1-1 | 100.0 | 3-4 | 75.0 | 8 |
| Feb 29 | at Pomona-Pitzer | L, 87-66 | - | 8 | 2-4 | 50.0 | 0-0 | - | 0-0 | - | 4 |
| Date | Opponent | Score | gs | min | off | def | reb | ast | to | a/to | stl | blk | pf | dq |
|---|---|---|---|---|---|---|---|---|---|---|---|---|---|---|
| Oct 26 | Alumni | - | - | - | - | - | - | - | - | - | - | - | - | |
| Nov 2 | California Miramar | W, 101-70 | - | - | - | - | - | - | - | - | - | - | - | - |
| Nov 8 | Texas-Dallas | L, 74-71 | - | 15 | 1 | 2 | 3 | 1 | 1 | 1.0 | 0 | 0 | 1 | - |
| Nov 9 | Linfield | W, 94-69 | - | 15 | 1 | 1 | 2 | 1 | 1 | 1.0 | 1 | 0 | 4 | - |
| Nov 15 | Luther | W, 87-62 | - | 18 | 0 | 2 | 2 | 0 | 0 | - | 0 | 0 | 2 | - |
| Nov 16 | Southwestern (Tex.) | W, 87-70 | - | 8 | 0 | 1 | 1 | 0 | 2 | 0.0 | 1 | 0 | 1 | - |
| Nov 21 | at UC Riverside | L, 76-44 | - | 13 | 1 | 4 | 5 | 1 | 0 | - | 0 | 0 | 0 | 0 |
| Nov 27 | at UC Santa Cruz | W, 72-50 | - | 18 | 0 | 4 | 4 | 1 | 3 | 0.3 | 1 | 2 | 4 | - |
| Dec 4 | at Occidental | W, 83-73 | - | 10 | 0 | 1 | 1 | 0 | 1 | 0.0 | 0 | 0 | 2 | - |
| Dec 7 | Puget Sound | L, 74-72 | - | 7 | 0 | 0 | 0 | 0 | 2 | 0.0 | 1 | 0 | 1 | - |
| Dec 16 | UC Santa Cruz | W, 61-49 | - | 8 | 2 | 0 | 2 | 0 | 1 | 0.0 | 1 | 0 | 2 | - |
| Dec 18 | vs. Simpson | W, 87-75 | - | 15 | 1 | 5 | 6 | 2 | 2 | 1.0 | 1 | 0 | 1 | - |
| Dec 31 | Bethesda University | W, 97-86 | - | 15 | 3 | 3 | 6 | 0 | 4 | 0.0 | 1 | 0 | 0 | - |
| Jan 4 | Cal Lutheran | L, 68-65 | - | 17 | 0 | 0 | 0 | 0 | 0 | - | 1 | 0 | 2 | - |
| Jan 6 | at La Verne | W, 80-58 | - | 16 | 4 | 2 | 6 | 2 | 3 | 0.7 | 0 | 0 | 2 | - |
| Jan 11 | at Pomona-Pitzer | L, 86-74 | - | 12 | 1 | 1 | 2 | 0 | 1 | 0.0 | 2 | 0 | 0 | - |
| Jan 15 | Claremont-M-S | L, 77-60 | - | 22 | 3 | 3 | 6 | 1 | 2 | 0.5 | 0 | 0 | 4 | - |
| Jan 18 | Caltech | W, 67-62 | 1 | 16 | 0 | 1 | 1 | 1 | 3 | 0.3 | 0 | 2 | 1 | - |
| Jan 22 | at Chapman | L, 82-78 | 1 | 12 | 0 | 0 | 0 | 1 | 1 | 1.0 | 0 | 0 | 1 | - |
| Jan 25 | Whittier | W, 105-86 | - | 14 | 0 | 0 | 0 | 3 | 5 | 0.6 | 1 | 0 | 4 | - |
| Feb 1 | at Cal Lutheran | W, 100-61 | - | 12 | 2 | 5 | 7 | 1 | 1 | 1.0 | 2 | 0 | 4 | 0 |
| Feb 5 | Occidental | W, 85-60 | - | 10 | 0 | 2 | 2 | 2 | 2 | 1.0 | 0 | 0 | 0 | - |
| Feb 8 | Pomona-Pitzer | W, 94-77 | - | 15 | 0 | 2 | 2 | 1 | 0 | - | 1 | 0 | 1 | - |
| Feb 12 | Chapman | W, 87-81 | - | 9 | 0 | 0 | 0 | 0 | 1 | 0.0 | 0 | 0 | 0 | - |
| Feb 15 | at Caltech | W, 92-75 | - | 15 | 1 | 0 | 1 | 1 | 3 | 0.3 | 1 | 0 | 2 | - |
| Feb 19 | at Claremont-M-S | W, 82-80 | - | 11 | 0 | 1 | 1 | 1 | 0 | - | 1 | 0 | 2 | - |
| Feb 22 | at Whittier | W, 105-90 | - | 15 | 1 | 1 | 2 | 1 | 0 | - | 1 | 0 | 1 | - |
| Feb 25 | La Verne | W, 103-73 | 1 | 13 | 2 | 2 | 4 | 4 | 2 | 2.0 | 2 | 0 | 1 | - |
| Feb 28 | Claremont-M-S | W, 68-66 | - | 12 | 0 | 1 | 1 | 3 | 0 | - | 1 | 0 | 3 | - |
| Feb 29 | at Pomona-Pitzer | L, 87-66 | - | 8 | 0 | 3 | 3 | 2 | 1 | 2.0 | 1 | 0 | 2 | - |
| gp | gs | min/g | fg/g | pct | 3pt/g | pct | ft/g | pct | ppg | |
|---|---|---|---|---|---|---|---|---|---|---|
| 2016-17 | 21 | - | 6.5 | 0.4-2.3 | 18.4 | 0.0-0.2 | 0.0 | 0.8-1.1 | 69.6 | 1.6 |
| 2017-18 | 17 | 2 | 11.5 | 1.9-4.3 | 43.8 | 0.2-0.8 | 30.8 | 0.8-1.3 | 59.1 | 4.8 |
| 2018-19 | 22 | 10 | 11.1 | 1.9-3.9 | 48.2 | 0.2-0.5 | 33.3 | 1.0-1.6 | 63.9 | 5.0 |
| 2019-20 | 27 | 3 | 13.3 | 2.1-4.8 | 45.0 | 0.1-0.6 | 23.5 | 1.2-1.8 | 65.3 | 5.6 |
| Total | 87 | 15 | 10.7 | 1.6-3.9 | 41.7 | 0.1-0.5 | 26.1 | 1.0-1.5 | 64.6 | 4.3 |
| gp | gs | min | fg | pct | 3pt | pct | ft | pct | pts | |
|---|---|---|---|---|---|---|---|---|---|---|
| 2016-17 | 21 | - | 136 | 9-49 | 18.4 | 0-4 | 0.0 | 16-23 | 69.6 | 34 |
| 2017-18 | 17 | 2 | 195 | 32-73 | 43.8 | 4-13 | 30.8 | 13-22 | 59.1 | 81 |
| 2018-19 | 22 | 10 | 244 | 41-85 | 48.2 | 4-12 | 33.3 | 23-36 | 63.9 | 109 |
| 2019-20 | 27 | 3 | 358 | 58-129 | 45.0 | 4-17 | 23.5 | 32-49 | 65.3 | 152 |
| Total | 87 | 15 | 933 | 140-336 | 41.7 | 12-46 | 26.1 | 84-130 | 64.6 | 376 |
| gp | gs | min/g | fg/40 | pct | 3pt/40 | pct | ft/40 | pct | pts/40 | |
|---|---|---|---|---|---|---|---|---|---|---|
| 2016-17 | 21 | - | 6.5 | 2.6-14.4 | 18.4 | 0.0-1.2 | 0.0 | 4.7-6.8 | 69.6 | 10.0 |
| 2017-18 | 17 | 2 | 11.5 | 6.6-15.0 | 43.8 | 0.8-2.7 | 30.8 | 2.7-4.5 | 59.1 | 16.6 |
| 2018-19 | 22 | 10 | 11.1 | 6.7-13.9 | 48.2 | 0.7-2.0 | 33.3 | 3.8-5.9 | 63.9 | 17.9 |
| 2019-20 | 27 | 3 | 13.3 | 6.5-14.4 | 45.0 | 0.4-1.9 | 23.5 | 3.6-5.5 | 65.3 | 17.0 |
| Total | 87 | 15 | 10.7 | 6.0-14.4 | 41.7 | 0.5-2.0 | 26.1 | 3.6-5.6 | 64.6 | 16.1 |
| gp | gs | mpg | off/g | def/g | reb/g | pf/g | dq/g | ast/g | to/g | a/to | stl/g | blk/g | |
|---|---|---|---|---|---|---|---|---|---|---|---|---|---|
| 2016-17 | 21 | - | 6.5 | 0.5 | 1.0 | 1.5 | 1.1 | 0.0 | 0.2 | 1.0 | 0.2 | 0.4 | 0.0 |
| 2017-18 | 17 | 2 | 11.5 | 1.1 | 1.7 | 2.8 | 1.9 | 0.0 | 0.4 | 1.6 | 0.3 | 0.2 | 0.2 |
| 2018-19 | 22 | 10 | 11.1 | 0.6 | 1.4 | 2.0 | 1.9 | 0.0 | 0.7 | 1.6 | 0.4 | 0.4 | 0.1 |
| 2019-20 | 27 | 3 | 13.3 | 0.8 | 1.6 | 2.4 | 1.8 | 0.0 | 1.1 | 1.6 | 0.7 | 0.8 | 0.1 |
| Total | 87 | 15 | 10.7 | 0.7 | 1.4 | 2.2 | 1.7 | 0.0 | 0.6 | 1.4 | 0.4 | 0.5 | 0.1 |
| gp | gs | mpg | off/40 | def/40 | reb/40 | pf/40 | dq/40 | ast/40 | to/40 | a/to | stl/40 | blk/40 | |
|---|---|---|---|---|---|---|---|---|---|---|---|---|---|
| 2016-17 | 21 | - | 6.5 | 3.2 | 6.2 | 9.4 | 7.1 | 0.0 | 1.2 | 5.9 | 0.2 | 2.4 | 0.3 |
| 2017-18 | 17 | 2 | 11.5 | 3.7 | 5.9 | 9.6 | 6.6 | 0.0 | 1.4 | 5.5 | 0.3 | 0.8 | 0.8 |
| 2018-19 | 22 | 10 | 11.1 | 2.3 | 5.1 | 7.4 | 6.9 | 0.2 | 2.5 | 5.7 | 0.4 | 1.5 | 0.5 |
| 2019-20 | 27 | 3 | 13.3 | 2.5 | 4.8 | 7.3 | 5.4 | 0.0 | 3.2 | 4.7 | 0.7 | 2.3 | 0.4 |
| Total | 87 | 15 | 10.7 | 2.8 | 5.3 | 8.1 | 6.3 | 0.0 | 2.4 | 5.3 | 0.4 | 1.8 | 0.5 |
| gp | gs | min/g | fg/g | pct | 3pt/g | pct | ft/g | pct | ppg | |
|---|---|---|---|---|---|---|---|---|---|---|
| Total | 27 | 3 | 13.3 | 2.1-4.8 | 45.0 | 0.1-0.6 | 23.5 | 1.2-1.8 | 65.3 | 5.6 |
| Conference | 16 | 3 | 13.7 | 2.1-4.6 | 45.2 | 0.1-0.6 | 11.1 | 1.0-1.7 | 59.3 | 5.2 |
| Exhibition | 1 | - | 13.0 | 1.0-3.0 | 33.3 | 0.0-1.0 | 0.0 | 0.0-0.0 | - | 2.0 |
- | ||||||||||
| Home | 16 | 2 | 13.4 | 1.8-4.6 | 39.7 | 0.1-0.7 | 18.2 | 1.2-1.7 | 74.1 | 5.0 |
| Away | 10 | 1 | 12.9 | 2.5-4.9 | 51.0 | 0.1-0.5 | 20.0 | 0.9-1.8 | 50.0 | 6.0 |
| Neutral | 1 | - | 15.0 | 4.0-7.0 | 57.1 | 1.0-1.0 | 100.0 | 3.0-4.0 | 75.0 | 12.0 |
- | ||||||||||
| Wins | 20 | 2 | 13.3 | 2.4-5.0 | 47.5 | 0.2-0.7 | 28.6 | 1.5-2.4 | 63.8 | 6.5 |
| Losses | 7 | 1 | 13.3 | 1.4-4.0 | 35.7 | 0.0-0.4 | 0.0 | 0.3-0.3 | 100.0 | 3.1 |
- | ||||||||||
| November | 5 | - | 14.8 | 2.4-6.2 | 38.7 | 0.2-1.2 | 16.7 | 1.0-1.4 | 71.4 | 6.0 |
| December | 5 | - | 11.0 | 2.2-4.2 | 52.4 | 0.2-0.2 | 100.0 | 1.6-2.2 | 72.7 | 6.2 |
| January | 7 | 2 | 15.6 | 2.1-5.0 | 42.9 | 0.0-0.4 | 0.0 | 0.6-1.0 | 57.1 | 4.9 |
| February | 10 | 1 | 12.0 | 2.0-4.2 | 47.6 | 0.2-0.7 | 28.6 | 1.5-2.4 | 62.5 | 5.7 |
| gp | gs | min | fg | pct | 3pt | pct | ft | pct | pts | |
|---|---|---|---|---|---|---|---|---|---|---|
| Total | 27 | 3 | 358 | 58-129 | 45.0 | 4-17 | 23.5 | 32-49 | 65.3 | 152 |
| Conference | 16 | 3 | 219 | 33-73 | 45.2 | 1-9 | 11.1 | 16-27 | 59.3 | 83 |
| Exhibition | 1 | - | 13 | 1-3 | 33.3 | 0-1 | 0.0 | 0-0 | - | 2 |
- | ||||||||||
| Home | 16 | 2 | 214 | 29-73 | 39.7 | 2-11 | 18.2 | 20-27 | 74.1 | 80 |
| Away | 10 | 1 | 129 | 25-49 | 51.0 | 1-5 | 20.0 | 9-18 | 50.0 | 60 |
| Neutral | 1 | - | 15 | 4-7 | 57.1 | 1-1 | 100.0 | 3-4 | 75.0 | 12 |
- | ||||||||||
| Wins | 20 | 2 | 265 | 48-101 | 47.5 | 4-14 | 28.6 | 30-47 | 63.8 | 130 |
| Losses | 7 | 1 | 93 | 10-28 | 35.7 | 0-3 | 0.0 | 2-2 | 100.0 | 22 |
- | ||||||||||
| November | 5 | - | 74 | 12-31 | 38.7 | 1-6 | 16.7 | 5-7 | 71.4 | 30 |
| December | 5 | - | 55 | 11-21 | 52.4 | 1-1 | 100.0 | 8-11 | 72.7 | 31 |
| January | 7 | 2 | 109 | 15-35 | 42.9 | 0-3 | 0.0 | 4-7 | 57.1 | 34 |
| February | 10 | 1 | 120 | 20-42 | 47.6 | 2-7 | 28.6 | 15-24 | 62.5 | 57 |
| gp | gs | min/g | fg/40 | pct | 3pt/40 | pct | ft/40 | pct | pts/40 | |
|---|---|---|---|---|---|---|---|---|---|---|
| Total | 27 | 3 | 13.3 | 6.5-14.4 | 45.0 | 0.4-1.9 | 23.5 | 3.6-5.5 | 65.3 | 17.0 |
| Conference | 16 | 3 | 13.7 | 6.0-13.3 | 45.2 | 0.2-1.6 | 11.1 | 2.9-4.9 | 59.3 | 15.2 |
| Exhibition | 1 | - | 13.0 | 3.1-9.2 | 33.3 | 0.0-3.1 | 0.0 | 0.0-0.0 | - | 6.2 |
- | ||||||||||
| Home | 16 | 2 | 13.4 | 5.4-13.6 | 39.7 | 0.4-2.1 | 18.2 | 3.7-5.0 | 74.1 | 15.0 |
| Away | 10 | 1 | 12.9 | 7.8-15.2 | 51.0 | 0.3-1.6 | 20.0 | 2.8-5.6 | 50.0 | 18.6 |
| Neutral | 1 | - | 15.0 | 10.7-18.7 | 57.1 | 2.7-2.7 | 100.0 | 8.0-10.7 | 75.0 | 32.0 |
- | ||||||||||
| Wins | 20 | 2 | 13.3 | 7.2-15.2 | 47.5 | 0.6-2.1 | 28.6 | 4.5-7.1 | 63.8 | 19.6 |
| Losses | 7 | 1 | 13.3 | 4.3-12.0 | 35.7 | 0.0-1.3 | 0.0 | 0.9-0.9 | 100.0 | 9.5 |
- | ||||||||||
| November | 5 | - | 14.8 | 6.5-16.8 | 38.7 | 0.5-3.2 | 16.7 | 2.7-3.8 | 71.4 | 16.2 |
| December | 5 | - | 11.0 | 8.0-15.3 | 52.4 | 0.7-0.7 | 100.0 | 5.8-8.0 | 72.7 | 22.5 |
| January | 7 | 2 | 15.6 | 5.5-12.8 | 42.9 | 0.0-1.1 | 0.0 | 1.5-2.6 | 57.1 | 12.5 |
| February | 10 | 1 | 12.0 | 6.7-14.0 | 47.6 | 0.7-2.3 | 28.6 | 5.0-8.0 | 62.5 | 19.0 |
| gp | gs | mpg | off/g | def/g | reb/g | pf/g | dq/g | ast/g | to/g | a/to | stl/g | blk/g | |
|---|---|---|---|---|---|---|---|---|---|---|---|---|---|
| Total | 27 | 3 | 13.3 | 0.8 | 1.6 | 2.4 | 1.8 | 0.0 | 1.1 | 1.6 | 0.7 | 0.8 | 0.1 |
| Conference | 16 | 3 | 13.7 | 0.9 | 1.3 | 2.2 | 1.7 | 0.0 | 1.2 | 1.6 | 0.8 | 0.8 | 0.1 |
| Exhibition | 1 | - | 13.0 | 1.0 | 4.0 | 5.0 | 0.0 | 0.0 | 1.0 | 0.0 | - | 0.0 | 0.0 |
- | |||||||||||||
| Home | 16 | 2 | 13.4 | 0.8 | 1.3 | 2.0 | 1.7 | - | 1.1 | 1.6 | 0.7 | 0.7 | 0.1 |
| Away | 10 | 1 | 12.9 | 0.9 | 1.8 | 2.7 | 2.0 | 0.0 | 1.0 | 1.4 | 0.7 | 0.9 | 0.2 |
| Neutral | 1 | - | 15.0 | 1.0 | 5.0 | 6.0 | 1.0 | - | 2.0 | 2.0 | 1.0 | 1.0 | 0.0 |
- | |||||||||||||
| Wins | 20 | 2 | 13.3 | 0.8 | 1.7 | 2.5 | 1.9 | 0.0 | 1.2 | 1.7 | 0.7 | 0.8 | 0.2 |
| Losses | 7 | 1 | 13.3 | 0.7 | 1.3 | 2.0 | 1.6 | - | 0.7 | 1.1 | 0.6 | 0.7 | 0.0 |
- | |||||||||||||
| November | 5 | - | 14.8 | 0.4 | 2.0 | 2.4 | 2.4 | - | 0.6 | 1.4 | 0.4 | 0.6 | 0.4 |
| December | 5 | - | 11.0 | 1.2 | 1.8 | 3.0 | 1.2 | - | 0.4 | 2.0 | 0.2 | 0.8 | 0.0 |
| January | 7 | 2 | 15.6 | 1.1 | 1.0 | 2.1 | 2.0 | - | 1.1 | 2.1 | 0.5 | 0.6 | 0.3 |
| February | 10 | 1 | 12.0 | 0.6 | 1.7 | 2.3 | 1.6 | 0.0 | 1.6 | 1.0 | 1.6 | 1.0 | 0.0 |
| gp | gs | min | off | def | reb | pf | dq | ast | to | a/to | stl | blk | |
|---|---|---|---|---|---|---|---|---|---|---|---|---|---|
| Total | 27 | 3 | 358 | 22 | 43 | 65 | 48 | 0 | 29 | 42 | 0.7 | 21 | 4 |
| Conference | 16 | 3 | 219 | 14 | 21 | 35 | 27 | 0 | 19 | 25 | 0.8 | 12 | 2 |
| Exhibition | 1 | - | 13 | 1 | 4 | 5 | 0 | 0 | 1 | 0 | - | 0 | 0 |
- | |||||||||||||
| Home | 16 | 2 | 214 | 12 | 20 | 32 | 27 | - | 17 | 26 | 0.7 | 11 | 2 |
| Away | 10 | 1 | 129 | 9 | 18 | 27 | 20 | 0 | 10 | 14 | 0.7 | 9 | 2 |
| Neutral | 1 | - | 15 | 1 | 5 | 6 | 1 | - | 2 | 2 | 1.0 | 1 | 0 |
- | |||||||||||||
| Wins | 20 | 2 | 265 | 17 | 34 | 51 | 37 | 0 | 24 | 34 | 0.7 | 16 | 4 |
| Losses | 7 | 1 | 93 | 5 | 9 | 14 | 11 | - | 5 | 8 | 0.6 | 5 | 0 |
- | |||||||||||||
| November | 5 | - | 74 | 2 | 10 | 12 | 12 | - | 3 | 7 | 0.4 | 3 | 2 |
| December | 5 | - | 55 | 6 | 9 | 15 | 6 | - | 2 | 10 | 0.2 | 4 | 0 |
| January | 7 | 2 | 109 | 8 | 7 | 15 | 14 | - | 8 | 15 | 0.5 | 4 | 2 |
| February | 10 | 1 | 120 | 6 | 17 | 23 | 16 | 0 | 16 | 10 | 1.6 | 10 | 0 |
| gp | gs | mpg | off/40 | def/40 | reb/40 | pf/40 | dq/40 | ast/40 | to/40 | a/to | stl/40 | blk/40 | |
|---|---|---|---|---|---|---|---|---|---|---|---|---|---|
| Total | 27 | 3 | 13.3 | 2.5 | 4.8 | 7.3 | 5.4 | 0.0 | 3.2 | 4.7 | 0.7 | 2.3 | 0.4 |
| Conference | 16 | 3 | 13.7 | 2.6 | 3.8 | 6.4 | 4.9 | 0.0 | 3.5 | 4.6 | 0.8 | 2.2 | 0.4 |
| Exhibition | 1 | - | 13.0 | 3.1 | 12.3 | 15.4 | 0.0 | 0.0 | 3.1 | 0.0 | - | 0.0 | 0.0 |
- | |||||||||||||
| Home | 16 | 2 | 13.4 | 2.2 | 3.7 | 6.0 | 5.0 | 0.0 | 3.2 | 4.9 | 0.7 | 2.1 | 0.4 |
| Away | 10 | 1 | 12.9 | 2.8 | 5.6 | 8.4 | 6.2 | 0.0 | 3.1 | 4.3 | 0.7 | 2.8 | 0.6 |
| Neutral | 1 | - | 15.0 | 2.7 | 13.3 | 16.0 | 2.7 | 0.0 | 5.3 | 5.3 | 1.0 | 2.7 | 0.0 |
- | |||||||||||||
| Wins | 20 | 2 | 13.3 | 2.6 | 5.1 | 7.7 | 5.6 | 0.0 | 3.6 | 5.1 | 0.7 | 2.4 | 0.6 |
| Losses | 7 | 1 | 13.3 | 2.2 | 3.9 | 6.0 | 4.7 | 0.0 | 2.2 | 3.4 | 0.6 | 2.2 | 0.0 |
- | |||||||||||||
| November | 5 | - | 14.8 | 1.1 | 5.4 | 6.5 | 6.5 | 0.0 | 1.6 | 3.8 | 0.4 | 1.6 | 1.1 |
| December | 5 | - | 11.0 | 4.4 | 6.5 | 10.9 | 4.4 | 0.0 | 1.5 | 7.3 | 0.2 | 2.9 | 0.0 |
| January | 7 | 2 | 15.6 | 2.9 | 2.6 | 5.5 | 5.1 | 0.0 | 2.9 | 5.5 | 0.5 | 1.5 | 0.7 |
| February | 10 | 1 | 12.0 | 2.0 | 5.7 | 7.7 | 5.3 | 0.0 | 5.3 | 3.3 | 1.6 | 3.3 | 0.0 |

