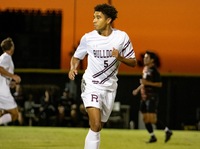


| Height: | 6-0 |
| Weight: | 185 |
| Year: | JR |
| Hometown: | Redlands, CA |
| High School: | Redlands |
| Position: | G |
| Major: | History |
2016-17: Quality guard in his second season with the Maroon and Gray… Competed in all 25 games while starting six of them… Scored 274 points on 44% shooting, which included 52 buckets from downtown at a clip of 40.9%... Went off for 25 with five three-pointers against Claremont-Mudd-Scripps Colleges… Upped the ante on this effort with a 26-point showing in the team’s 87-75 win at Pomona-Pitzer Colleges… Also converted 71.9% of his free-throws… Snagged 53 rebounds… Provided 44 assists and 18 steals… Also stepped up with four blocks…
2015-16: Great contributor off the bench in his rookie season as a Bulldog… Saw time in all 27 games… Helped the team to a two-way tie for second place in the regular season that led to an appearance in the final of the SCIAC Postseason Tournament… Averaged 17.4 minutes per game and knocked down 77.4% of his free-throws… Great player on both sides of the ball, as shown by 167 points, 45 rebounds, 33 assists, and 11 steals… Enjoyed a breakout game against Life Pacific by going off for 14 points, which included a 4-for-5 showing from the field and a 2-for-3 effort from beyond the arc…
| Recent Games | ||
|---|---|---|
| Jan 31 | Chapman | L, 76-69 |
| Feb 3 | Pomona-Pitzer | L, 91-63 |
| Feb 7 | at La Verne | W, 79-73 |
| Feb 10 | at Caltech | L, 78-72 |
| Feb 17 | Cal Lutheran | W, 72-65 |
| Feb 20 | at Occidental | L, 89-69 |
| Statistics category | Overall | Conf | ||
|---|---|---|---|---|
| Games | 24 | 16 | ||
| Games started | 24 | 16 | ||
| Minutes | 712 | 457 | ||
| Minutes per game | 29.7 | 28.6 | ||
| FG | 109-271 | 65-171 | ||
| FG Pct | 40.2 | 38.0 | ||
| 3PT | 48-137 | 29-88 | ||
| 3PT Pct | 35.0 | 33.0 | ||
| FT | 53-70 | 28-40 | ||
| FT Pct | 75.7 | 70.0 | ||
| Off rebounds | 9 | 4 | ||
| Def rebounds | 55 | 29 | ||
| Total rebounds | 64 | 33 | ||
| Rebounds per game | 2.7 | 2.1 | ||
| Personal fouls | 61 | 42 | ||
| Disqualifications | 1 | 1 | ||
| Assists | 69 | 41 | ||
| Turnovers | 46 | 23 | ||
| Assist to turnover ratio | 1.5 | 1.8 | ||
| Steals | 22 | 17 | ||
| Blocks | 3 | 2 | ||
| Points | 319 | 187 | ||
| Points per game | 13.3 | 11.7 | ||
| Points per 40 min | 17.9 | 16.4 | ||
| Date | Opponent | Score | gs | min | fg | pct | 3pt | pct | ft | pct | pts |
|---|---|---|---|---|---|---|---|---|---|---|---|
| Oct 28 | Alumni | - | - | - | - | - | - | - | - | - | |
| Nov 4 | at Vanguard | L, 107-71 | 1 | 23 | 3-8 | 37.5 | 1-5 | 20.0 | 3-4 | 75.0 | 10 |
| Nov 11 | at Westmont | L, 91-85 | 1 | 25 | 6-14 | 42.9 | 5-10 | 50.0 | 0-0 | - | 17 |
| Nov 17 | vs. Pacific (Ore.) | L, 85-79 | 1 | 39 | 5-11 | 45.5 | 1-5 | 20.0 | 5-6 | 83.3 | 16 |
| Nov 18 | at Puget Sound | L, 118-112 | 1 | 32 | 9-16 | 56.3 | 3-7 | 42.9 | 0-0 | - | 21 |
| Nov 22 | Puget Sound | L, 116-115 | 1 | 31 | 3-11 | 27.3 | 2-4 | 50.0 | 5-6 | 83.3 | 13 |
| Dec 1 | UC Santa Cruz | W, 80-74 | 1 | 37 | 5-12 | 41.7 | 3-8 | 37.5 | 5-6 | 83.3 | 18 |
| Dec 2 | Wis.-Whitewater | L, 69-60 | 1 | 37 | 6-13 | 46.2 | 1-5 | 20.0 | 4-4 | 100.0 | 17 |
| Dec 6 | Claremont-M-S | W, 72-67 | 1 | 32 | 6-18 | 33.3 | 2-8 | 25.0 | 5-7 | 71.4 | 19 |
| Dec 18 | at Hope Int'l | L, 84-43 | 1 | 24 | 3-10 | 30.0 | 0-3 | 0.0 | 3-4 | 75.0 | 9 |
| Dec 21 | Whitman | L, 119-93 | 1 | 28 | 4-13 | 30.8 | 4-9 | 44.4 | 3-4 | 75.0 | 15 |
| Dec 28 | Gordon | W, 87-56 | 1 | 27 | 9-14 | 64.3 | 5-8 | 62.5 | 0-0 | - | 23 |
| Jan 1 | at Pomona-Pitzer | L, 101-90 | 1 | 26 | 3-9 | 33.3 | 1-2 | 50.0 | 0-0 | - | 7 |
| Jan 3 | at Chapman | L, 82-73 | 1 | 26 | 3-6 | 50.0 | 0-1 | 0.0 | 0-1 | 0.0 | 6 |
| Jan 6 | Caltech | W, 76-64 | 1 | 25 | 2-7 | 28.6 | 0-3 | 0.0 | 0-0 | - | 4 |
| Jan 8 | Whittier | L, 91-88 | 1 | 33 | 7-11 | 63.6 | 4-5 | 80.0 | 2-2 | 100.0 | 20 |
| Jan 10 | La Verne | W, 80-74 | 1 | 28 | 6-10 | 60.0 | 3-6 | 50.0 | 3-4 | 75.0 | 18 |
| Jan 13 | at Cal Lutheran | L, 93-84 | 1 | 23 | 3-10 | 30.0 | 2-4 | 50.0 | 0-0 | - | 8 |
| Jan 17 | UC Santa Cruz | L, 84-56 | - | - | - | - | - | - | - | - | - |
| Jan 20 | Occidental | L, 67-62 | 1 | 30 | 6-14 | 42.9 | 5-11 | 45.5 | 0-0 | - | 17 |
| Jan 24 | at Claremont-M-S | L, 80-66 | 1 | 28 | 5-13 | 38.5 | 1-7 | 14.3 | 2-2 | 100.0 | 13 |
| Jan 27 | at Whittier | L, 93-92 | 1 | 35 | 8-18 | 44.4 | 4-11 | 36.4 | 5-6 | 83.3 | 25 |
| Jan 31 | Chapman | L, 76-69 | 1 | 33 | 3-10 | 30.0 | 1-7 | 14.3 | 2-3 | 66.7 | 9 |
| Feb 3 | Pomona-Pitzer | L, 91-63 | 1 | 23 | 0-7 | 0.0 | 0-4 | 0.0 | 5-6 | 83.3 | 5 |
| Feb 7 | at La Verne | W, 79-73 | 1 | 34 | 2-7 | 28.6 | 1-4 | 25.0 | 1-4 | 25.0 | 6 |
| Feb 10 | at Caltech | L, 78-72 | 1 | 30 | 5-14 | 35.7 | 2-7 | 28.6 | 3-5 | 60.0 | 15 |
| Feb 17 | Cal Lutheran | W, 72-65 | 1 | 29 | 2-9 | 22.2 | 1-4 | 25.0 | 0-0 | - | 5 |
| Feb 20 | at Occidental | L, 89-69 | 1 | 22 | 4-8 | 50.0 | 2-4 | 50.0 | 0-0 | - | 10 |
| Date | Opponent | Score | gs | min | off | def | reb | ast | to | a/to | stl | blk | pf | dq |
|---|---|---|---|---|---|---|---|---|---|---|---|---|---|---|
| Oct 28 | Alumni | - | - | - | - | - | - | - | - | - | - | - | - | |
| Nov 4 | at Vanguard | L, 107-71 | 1 | 23 | 0 | 1 | 1 | 2 | 2 | 1.0 | 1 | 0 | 2 | - |
| Nov 11 | at Westmont | L, 91-85 | 1 | 25 | 0 | 1 | 1 | 1 | 5 | 0.2 | 0 | 0 | 3 | - |
| Nov 17 | vs. Pacific (Ore.) | L, 85-79 | 1 | 39 | 0 | 1 | 1 | 2 | 4 | 0.5 | 0 | 0 | 2 | 0 |
| Nov 18 | at Puget Sound | L, 118-112 | 1 | 32 | 1 | 2 | 3 | 3 | 4 | 0.8 | 0 | 0 | 3 | - |
| Nov 22 | Puget Sound | L, 116-115 | 1 | 31 | 1 | 5 | 6 | 8 | 5 | 1.6 | 3 | 0 | 2 | - |
| Dec 1 | UC Santa Cruz | W, 80-74 | 1 | 37 | 0 | 3 | 3 | 6 | 2 | 3.0 | 1 | 0 | 1 | - |
| Dec 2 | Wis.-Whitewater | L, 69-60 | 1 | 37 | 2 | 6 | 8 | 1 | 3 | 0.3 | 0 | 0 | 3 | - |
| Dec 6 | Claremont-M-S | W, 72-67 | 1 | 32 | 2 | 3 | 5 | 3 | 2 | 1.5 | 2 | 0 | 1 | - |
| Dec 18 | at Hope Int'l | L, 84-43 | 1 | 24 | 1 | 2 | 3 | 0 | 1 | 0.0 | 0 | 0 | 1 | - |
| Dec 21 | Whitman | L, 119-93 | 1 | 28 | 0 | 3 | 3 | 4 | 3 | 1.3 | 1 | 1 | 3 | - |
| Dec 28 | Gordon | W, 87-56 | 1 | 27 | 0 | 4 | 4 | 4 | 1 | 4.0 | 0 | 0 | 4 | - |
| Jan 1 | at Pomona-Pitzer | L, 101-90 | 1 | 26 | 1 | 5 | 6 | 3 | 2 | 1.5 | 0 | 0 | 1 | - |
| Jan 3 | at Chapman | L, 82-73 | 1 | 26 | 0 | 2 | 2 | 1 | 2 | 0.5 | 2 | 0 | 4 | - |
| Jan 6 | Caltech | W, 76-64 | 1 | 25 | 0 | 1 | 1 | 2 | 1 | 2.0 | 3 | 0 | 2 | - |
| Jan 8 | Whittier | L, 91-88 | 1 | 33 | 0 | 1 | 1 | 6 | 1 | 6.0 | 0 | 0 | 1 | - |
| Jan 10 | La Verne | W, 80-74 | 1 | 28 | 0 | 1 | 1 | 2 | 1 | 2.0 | 1 | 0 | 2 | - |
| Jan 13 | at Cal Lutheran | L, 93-84 | 1 | 23 | 1 | 0 | 1 | 3 | 0 | - | 2 | 0 | 2 | - |
| Jan 17 | UC Santa Cruz | L, 84-56 | - | - | - | - | - | - | - | - | - | - | - | - |
| Jan 20 | Occidental | L, 67-62 | 1 | 30 | 0 | 2 | 2 | 3 | 2 | 1.5 | 1 | 1 | 4 | - |
| Jan 24 | at Claremont-M-S | L, 80-66 | 1 | 28 | 0 | 2 | 2 | 0 | 2 | 0.0 | 0 | 0 | 5 | 1 |
| Jan 27 | at Whittier | L, 93-92 | 1 | 35 | 0 | 3 | 3 | 1 | 3 | 0.3 | 3 | 0 | 2 | - |
| Jan 31 | Chapman | L, 76-69 | 1 | 33 | 0 | 1 | 1 | 1 | 1 | 1.0 | 0 | 0 | 4 | - |
| Feb 3 | Pomona-Pitzer | L, 91-63 | 1 | 23 | 0 | 0 | 0 | 3 | 1 | 3.0 | 0 | 0 | 2 | - |
| Feb 7 | at La Verne | W, 79-73 | 1 | 34 | 0 | 2 | 2 | 5 | 1 | 5.0 | 1 | 1 | 2 | - |
| Feb 10 | at Caltech | L, 78-72 | 1 | 30 | 0 | 4 | 4 | 4 | 1 | 4.0 | 1 | 0 | 3 | - |
| Feb 17 | Cal Lutheran | W, 72-65 | 1 | 29 | 0 | 0 | 0 | 3 | 3 | 1.0 | 0 | 0 | 3 | - |
| Feb 20 | at Occidental | L, 89-69 | 1 | 22 | 0 | 2 | 2 | 1 | 0 | - | 1 | 0 | 4 | - |
| gp | gs | min/g | fg/g | pct | 3pt/g | pct | ft/g | pct | ppg | |
|---|---|---|---|---|---|---|---|---|---|---|
| 2015-16 | 27 | - | 17.4 | 2.1-4.5 | 45.9 | 1.1-3.0 | 38.3 | 0.9-1.1 | 77.4 | 6.2 |
| 2016-17 | 25 | 6 | 25.8 | 3.5-8.0 | 44.0 | 2.1-5.1 | 40.9 | 1.8-2.6 | 71.9 | 11.0 |
| 2017-18 | 24 | 24 | 29.7 | 4.5-11.3 | 40.2 | 2.0-5.7 | 35.0 | 2.2-2.9 | 75.7 | 13.3 |
| 2018-19 | 26 | 26 | 31.5 | 5.8-13.4 | 43.7 | 2.8-7.2 | 38.3 | 2.7-3.8 | 72.4 | 17.2 |
| Total | 102 | 56 | 26.0 | 4.0-9.2 | 43.0 | 2.0-5.2 | 38.1 | 1.9-2.6 | 73.8 | 11.8 |
| gp | gs | min | fg | pct | 3pt | pct | ft | pct | pts | |
|---|---|---|---|---|---|---|---|---|---|---|
| 2015-16 | 27 | - | 470 | 56-122 | 45.9 | 31-81 | 38.3 | 24-31 | 77.4 | 167 |
| 2016-17 | 25 | 6 | 645 | 88-200 | 44.0 | 52-127 | 40.9 | 46-64 | 71.9 | 274 |
| 2017-18 | 24 | 24 | 712 | 109-271 | 40.2 | 48-137 | 35.0 | 53-70 | 75.7 | 319 |
| 2018-19 | 26 | 26 | 820 | 152-348 | 43.7 | 72-188 | 38.3 | 71-98 | 72.4 | 447 |
| Total | 102 | 56 | 2647 | 405-941 | 43.0 | 203-533 | 38.1 | 194-263 | 73.8 | 1207 |
| gp | gs | min/g | fg/40 | pct | 3pt/40 | pct | ft/40 | pct | pts/40 | |
|---|---|---|---|---|---|---|---|---|---|---|
| 2015-16 | 27 | - | 17.4 | 4.8-10.4 | 45.9 | 2.6-6.9 | 38.3 | 2.0-2.6 | 77.4 | 14.2 |
| 2016-17 | 25 | 6 | 25.8 | 5.5-12.4 | 44.0 | 3.2-7.9 | 40.9 | 2.9-4.0 | 71.9 | 17.0 |
| 2017-18 | 24 | 24 | 29.7 | 6.1-15.2 | 40.2 | 2.7-7.7 | 35.0 | 3.0-3.9 | 75.7 | 17.9 |
| 2018-19 | 26 | 26 | 31.5 | 7.4-17.0 | 43.7 | 3.5-9.2 | 38.3 | 3.5-4.8 | 72.4 | 21.8 |
| Total | 102 | 56 | 26.0 | 6.1-14.2 | 43.0 | 3.1-8.1 | 38.1 | 2.9-4.0 | 73.8 | 18.2 |
| gp | gs | mpg | off/g | def/g | reb/g | pf/g | dq/g | ast/g | to/g | a/to | stl/g | blk/g | |
|---|---|---|---|---|---|---|---|---|---|---|---|---|---|
| 2015-16 | 27 | - | 17.4 | 0.3 | 1.3 | 1.7 | 1.1 | 0.0 | 1.2 | 1.1 | 1.1 | 0.4 | 0.0 |
| 2016-17 | 25 | 6 | 25.8 | 0.4 | 1.7 | 2.1 | 1.6 | 0.0 | 1.8 | 1.8 | 1.0 | 0.7 | 0.2 |
| 2017-18 | 24 | 24 | 29.7 | 0.4 | 2.3 | 2.7 | 2.5 | 0.0 | 2.9 | 1.9 | 1.5 | 0.9 | 0.1 |
| 2018-19 | 26 | 26 | 31.5 | 0.6 | 2.5 | 3.2 | 2.2 | 0.0 | 3.8 | 1.7 | 2.3 | 1.3 | 0.2 |
| Total | 102 | 56 | 26.0 | 0.4 | 2.0 | 2.4 | 1.9 | 0.0 | 2.4 | 1.6 | 1.5 | 0.8 | 0.1 |
| gp | gs | mpg | off/40 | def/40 | reb/40 | pf/40 | dq/40 | ast/40 | to/40 | a/to | stl/40 | blk/40 | |
|---|---|---|---|---|---|---|---|---|---|---|---|---|---|
| 2015-16 | 27 | - | 17.4 | 0.8 | 3.1 | 3.8 | 2.6 | 0.0 | 2.8 | 2.6 | 1.1 | 0.9 | 0.1 |
| 2016-17 | 25 | 6 | 25.8 | 0.7 | 2.6 | 3.3 | 2.5 | 0.0 | 2.7 | 2.7 | 1.0 | 1.1 | 0.2 |
| 2017-18 | 24 | 24 | 29.7 | 0.5 | 3.1 | 3.6 | 3.4 | 0.1 | 3.9 | 2.6 | 1.5 | 1.2 | 0.2 |
| 2018-19 | 26 | 26 | 31.5 | 0.8 | 3.2 | 4.0 | 2.7 | 0.0 | 4.9 | 2.1 | 2.3 | 1.7 | 0.2 |
| Total | 102 | 56 | 26.0 | 0.7 | 3.0 | 3.7 | 2.9 | 0.0 | 3.7 | 2.5 | 1.5 | 1.3 | 0.2 |
| gp | gs | min/g | fg/g | pct | 3pt/g | pct | ft/g | pct | ppg | |
|---|---|---|---|---|---|---|---|---|---|---|
| Total | 24 | 24 | 29.7 | 4.5-11.3 | 40.2 | 2.0-5.7 | 35.0 | 2.2-2.9 | 75.7 | 13.3 |
| Conference | 16 | 16 | 28.6 | 4.1-10.7 | 38.0 | 1.8-5.5 | 33.0 | 1.8-2.5 | 70.0 | 11.7 |
| Exhibition | 2 | 2 | 24.0 | 4.5-11.0 | 40.9 | 3.0-7.5 | 40.0 | 1.5-2.0 | 75.0 | 13.5 |
- | ||||||||||
| Home | 13 | 13 | 30.2 | 4.5-11.5 | 39.6 | 2.4-6.3 | 37.8 | 2.6-3.2 | 81.0 | 14.1 |
| Away | 10 | 10 | 28.0 | 4.5-11.1 | 40.5 | 1.6-5.0 | 32.0 | 1.4-2.2 | 63.6 | 12.0 |
| Neutral | 1 | 1 | 39.0 | 5.0-11.0 | 45.5 | 1.0-5.0 | 20.0 | 5.0-6.0 | 83.3 | 16.0 |
- | ||||||||||
| Wins | 7 | 7 | 30.3 | 4.6-11.0 | 41.6 | 2.1-5.9 | 36.6 | 2.0-3.0 | 66.7 | 13.3 |
| Losses | 17 | 17 | 29.4 | 4.5-11.4 | 39.7 | 1.9-5.6 | 34.4 | 2.3-2.9 | 79.6 | 13.3 |
- | ||||||||||
| November | 3 | 3 | 34.0 | 5.7-12.7 | 44.7 | 2.0-5.3 | 37.5 | 3.3-4.0 | 83.3 | 16.7 |
| December | 6 | 6 | 30.8 | 5.5-13.3 | 41.3 | 2.5-6.8 | 36.6 | 3.3-4.2 | 80.0 | 16.8 |
| January | 10 | 10 | 28.7 | 4.6-10.8 | 42.6 | 2.1-5.7 | 36.8 | 1.4-1.8 | 77.8 | 12.7 |
| February | 5 | 5 | 27.6 | 2.6-9.0 | 28.9 | 1.2-4.6 | 26.1 | 1.8-3.0 | 60.0 | 8.2 |
| gp | gs | min | fg | pct | 3pt | pct | ft | pct | pts | |
|---|---|---|---|---|---|---|---|---|---|---|
| Total | 24 | 24 | 712 | 109-271 | 40.2 | 48-137 | 35.0 | 53-70 | 75.7 | 319 |
| Conference | 16 | 16 | 457 | 65-171 | 38.0 | 29-88 | 33.0 | 28-40 | 70.0 | 187 |
| Exhibition | 2 | 2 | 48 | 9-22 | 40.9 | 6-15 | 40.0 | 3-4 | 75.0 | 27 |
- | ||||||||||
| Home | 13 | 13 | 393 | 59-149 | 39.6 | 31-82 | 37.8 | 34-42 | 81.0 | 183 |
| Away | 10 | 10 | 280 | 45-111 | 40.5 | 16-50 | 32.0 | 14-22 | 63.6 | 120 |
| Neutral | 1 | 1 | 39 | 5-11 | 45.5 | 1-5 | 20.0 | 5-6 | 83.3 | 16 |
- | ||||||||||
| Wins | 7 | 7 | 212 | 32-77 | 41.6 | 15-41 | 36.6 | 14-21 | 66.7 | 93 |
| Losses | 17 | 17 | 500 | 77-194 | 39.7 | 33-96 | 34.4 | 39-49 | 79.6 | 226 |
- | ||||||||||
| November | 3 | 3 | 102 | 17-38 | 44.7 | 6-16 | 37.5 | 10-12 | 83.3 | 50 |
| December | 6 | 6 | 185 | 33-80 | 41.3 | 15-41 | 36.6 | 20-25 | 80.0 | 101 |
| January | 10 | 10 | 287 | 46-108 | 42.6 | 21-57 | 36.8 | 14-18 | 77.8 | 127 |
| February | 5 | 5 | 138 | 13-45 | 28.9 | 6-23 | 26.1 | 9-15 | 60.0 | 41 |
| gp | gs | min/g | fg/40 | pct | 3pt/40 | pct | ft/40 | pct | pts/40 | |
|---|---|---|---|---|---|---|---|---|---|---|
| Total | 24 | 24 | 29.7 | 6.1-15.2 | 40.2 | 2.7-7.7 | 35.0 | 3.0-3.9 | 75.7 | 17.9 |
| Conference | 16 | 16 | 28.6 | 5.7-15.0 | 38.0 | 2.5-7.7 | 33.0 | 2.5-3.5 | 70.0 | 16.4 |
| Exhibition | 2 | 2 | 24.0 | 7.5-18.3 | 40.9 | 5.0-12.5 | 40.0 | 2.5-3.3 | 75.0 | 22.5 |
- | ||||||||||
| Home | 13 | 13 | 30.2 | 6.0-15.2 | 39.6 | 3.2-8.3 | 37.8 | 3.5-4.3 | 81.0 | 18.6 |
| Away | 10 | 10 | 28.0 | 6.4-15.9 | 40.5 | 2.3-7.1 | 32.0 | 2.0-3.1 | 63.6 | 17.1 |
| Neutral | 1 | 1 | 39.0 | 5.1-11.3 | 45.5 | 1.0-5.1 | 20.0 | 5.1-6.2 | 83.3 | 16.4 |
- | ||||||||||
| Wins | 7 | 7 | 30.3 | 6.0-14.5 | 41.6 | 2.8-7.7 | 36.6 | 2.6-4.0 | 66.7 | 17.5 |
| Losses | 17 | 17 | 29.4 | 6.2-15.5 | 39.7 | 2.6-7.7 | 34.4 | 3.1-3.9 | 79.6 | 18.1 |
- | ||||||||||
| November | 3 | 3 | 34.0 | 6.7-14.9 | 44.7 | 2.4-6.3 | 37.5 | 3.9-4.7 | 83.3 | 19.6 |
| December | 6 | 6 | 30.8 | 7.1-17.3 | 41.3 | 3.2-8.9 | 36.6 | 4.3-5.4 | 80.0 | 21.8 |
| January | 10 | 10 | 28.7 | 6.4-15.1 | 42.6 | 2.9-7.9 | 36.8 | 2.0-2.5 | 77.8 | 17.7 |
| February | 5 | 5 | 27.6 | 3.8-13.0 | 28.9 | 1.7-6.7 | 26.1 | 2.6-4.3 | 60.0 | 11.9 |
| gp | gs | mpg | off/g | def/g | reb/g | pf/g | dq/g | ast/g | to/g | a/to | stl/g | blk/g | |
|---|---|---|---|---|---|---|---|---|---|---|---|---|---|
| Total | 24 | 24 | 29.7 | 0.4 | 2.3 | 2.7 | 2.5 | 0.0 | 2.9 | 1.9 | 1.5 | 0.9 | 0.1 |
| Conference | 16 | 16 | 28.6 | 0.3 | 1.8 | 2.1 | 2.6 | 0.1 | 2.6 | 1.4 | 1.8 | 1.1 | 0.1 |
| Exhibition | 2 | 2 | 24.0 | 0.0 | 1.0 | 1.0 | 2.5 | - | 1.5 | 3.5 | 0.4 | 0.5 | 0.0 |
- | |||||||||||||
| Home | 13 | 13 | 30.2 | 0.4 | 2.3 | 2.7 | 2.5 | - | 3.5 | 2.0 | 1.8 | 0.9 | 0.2 |
| Away | 10 | 10 | 28.0 | 0.4 | 2.4 | 2.8 | 2.7 | 0.1 | 2.1 | 1.6 | 1.3 | 1.0 | 0.1 |
| Neutral | 1 | 1 | 39.0 | 0.0 | 1.0 | 1.0 | 2.0 | 0.0 | 2.0 | 4.0 | 0.5 | 0.0 | 0.0 |
- | |||||||||||||
| Wins | 7 | 7 | 30.3 | 0.3 | 2.0 | 2.3 | 2.1 | - | 3.6 | 1.6 | 2.3 | 1.1 | 0.1 |
| Losses | 17 | 17 | 29.4 | 0.4 | 2.4 | 2.8 | 2.7 | 0.1 | 2.6 | 2.1 | 1.3 | 0.8 | 0.1 |
- | |||||||||||||
| November | 3 | 3 | 34.0 | 0.7 | 2.7 | 3.3 | 2.3 | 0.0 | 4.3 | 4.3 | 1.0 | 1.0 | 0.0 |
| December | 6 | 6 | 30.8 | 0.8 | 3.5 | 4.3 | 2.2 | - | 3.0 | 2.0 | 1.5 | 0.7 | 0.2 |
| January | 10 | 10 | 28.7 | 0.2 | 1.8 | 2.0 | 2.7 | 0.1 | 2.2 | 1.5 | 1.5 | 1.2 | 0.1 |
| February | 5 | 5 | 27.6 | 0.0 | 1.6 | 1.6 | 2.8 | - | 3.2 | 1.2 | 2.7 | 0.6 | 0.2 |
| gp | gs | min | off | def | reb | pf | dq | ast | to | a/to | stl | blk | |
|---|---|---|---|---|---|---|---|---|---|---|---|---|---|
| Total | 24 | 24 | 712 | 9 | 55 | 64 | 61 | 1 | 69 | 46 | 1.5 | 22 | 3 |
| Conference | 16 | 16 | 457 | 4 | 29 | 33 | 42 | 1 | 41 | 23 | 1.8 | 17 | 2 |
| Exhibition | 2 | 2 | 48 | 0 | 2 | 2 | 5 | - | 3 | 7 | 0.4 | 1 | 0 |
- | |||||||||||||
| Home | 13 | 13 | 393 | 5 | 30 | 35 | 32 | - | 46 | 26 | 1.8 | 12 | 2 |
| Away | 10 | 10 | 280 | 4 | 24 | 28 | 27 | 1 | 21 | 16 | 1.3 | 10 | 1 |
| Neutral | 1 | 1 | 39 | 0 | 1 | 1 | 2 | 0 | 2 | 4 | 0.5 | 0 | 0 |
- | |||||||||||||
| Wins | 7 | 7 | 212 | 2 | 14 | 16 | 15 | - | 25 | 11 | 2.3 | 8 | 1 |
| Losses | 17 | 17 | 500 | 7 | 41 | 48 | 46 | 1 | 44 | 35 | 1.3 | 14 | 2 |
- | |||||||||||||
| November | 3 | 3 | 102 | 2 | 8 | 10 | 7 | 0 | 13 | 13 | 1.0 | 3 | 0 |
| December | 6 | 6 | 185 | 5 | 21 | 26 | 13 | - | 18 | 12 | 1.5 | 4 | 1 |
| January | 10 | 10 | 287 | 2 | 18 | 20 | 27 | 1 | 22 | 15 | 1.5 | 12 | 1 |
| February | 5 | 5 | 138 | 0 | 8 | 8 | 14 | - | 16 | 6 | 2.7 | 3 | 1 |
| gp | gs | mpg | off/40 | def/40 | reb/40 | pf/40 | dq/40 | ast/40 | to/40 | a/to | stl/40 | blk/40 | |
|---|---|---|---|---|---|---|---|---|---|---|---|---|---|
| Total | 24 | 24 | 29.7 | 0.5 | 3.1 | 3.6 | 3.4 | 0.1 | 3.9 | 2.6 | 1.5 | 1.2 | 0.2 |
| Conference | 16 | 16 | 28.6 | 0.4 | 2.5 | 2.9 | 3.7 | 0.1 | 3.6 | 2.0 | 1.8 | 1.5 | 0.2 |
| Exhibition | 2 | 2 | 24.0 | 0.0 | 1.7 | 1.7 | 4.2 | 0.0 | 2.5 | 5.8 | 0.4 | 0.8 | 0.0 |
- | |||||||||||||
| Home | 13 | 13 | 30.2 | 0.5 | 3.1 | 3.6 | 3.3 | 0.0 | 4.7 | 2.6 | 1.8 | 1.2 | 0.2 |
| Away | 10 | 10 | 28.0 | 0.6 | 3.4 | 4.0 | 3.9 | 0.1 | 3.0 | 2.3 | 1.3 | 1.4 | 0.1 |
| Neutral | 1 | 1 | 39.0 | 0.0 | 1.0 | 1.0 | 2.1 | 0.0 | 2.1 | 4.1 | 0.5 | 0.0 | 0.0 |
- | |||||||||||||
| Wins | 7 | 7 | 30.3 | 0.4 | 2.6 | 3.0 | 2.8 | 0.0 | 4.7 | 2.1 | 2.3 | 1.5 | 0.2 |
| Losses | 17 | 17 | 29.4 | 0.6 | 3.3 | 3.8 | 3.7 | 0.1 | 3.5 | 2.8 | 1.3 | 1.1 | 0.2 |
- | |||||||||||||
| November | 3 | 3 | 34.0 | 0.8 | 3.1 | 3.9 | 2.7 | 0.0 | 5.1 | 5.1 | 1.0 | 1.2 | 0.0 |
| December | 6 | 6 | 30.8 | 1.1 | 4.5 | 5.6 | 2.8 | 0.0 | 3.9 | 2.6 | 1.5 | 0.9 | 0.2 |
| January | 10 | 10 | 28.7 | 0.3 | 2.5 | 2.8 | 3.8 | 0.1 | 3.1 | 2.1 | 1.5 | 1.7 | 0.1 |
| February | 5 | 5 | 27.6 | 0.0 | 2.3 | 2.3 | 4.1 | 0.0 | 4.6 | 1.7 | 2.7 | 0.9 | 0.3 |


